Introducing SoilSense plant health
If you have been waiting for an easier overview of your irrigation data, this is for you. We have done our best to make it simple to see the health of your crops - making it easy to compare and maintain an overview of moisture in your soil for any given period.The SoilSense plant health is accessible directly on the front page after login, and can be used for:
- Easy overview of variations in plant available water for daily or weekly work
- Easy overview of the state of the soil over the entire season
The feature is available to all customers that grow in soil media and have enabled auto-soil calibration (ask us for help if you do not know what this means).
Four simple colors and you are ready to save water
Our software automatically looks at your irrigation data and establishes the field capacity of your soil. In this way we can provide you insights about plant available water: meaning how much water is available for your crops. We combine this with how much water different crops need to have available for the best growth conditions. 4 colours indicate the state of your soil:Green = both sensors are in safe range for crop
Yellow = one sensor is below safe range (dry)
Red = both sensors are below safe range (very dry)
Blue = over irrigation beyond field capacity
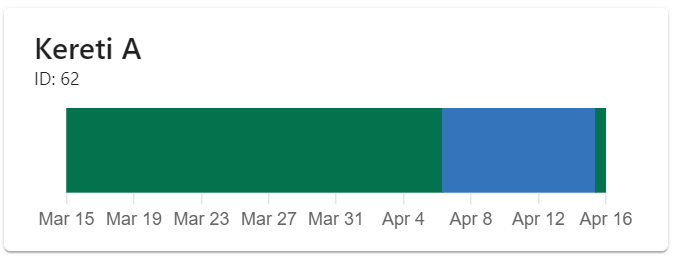
Example of a sensor location with ideal water conditions (green) changing to too wet (blue) during the selected period

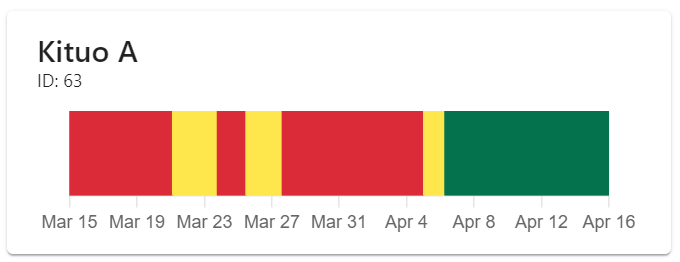
Example of a sensor location with very dry (red) and dry (yellow) conditions being irrigated to a healthy state (green)

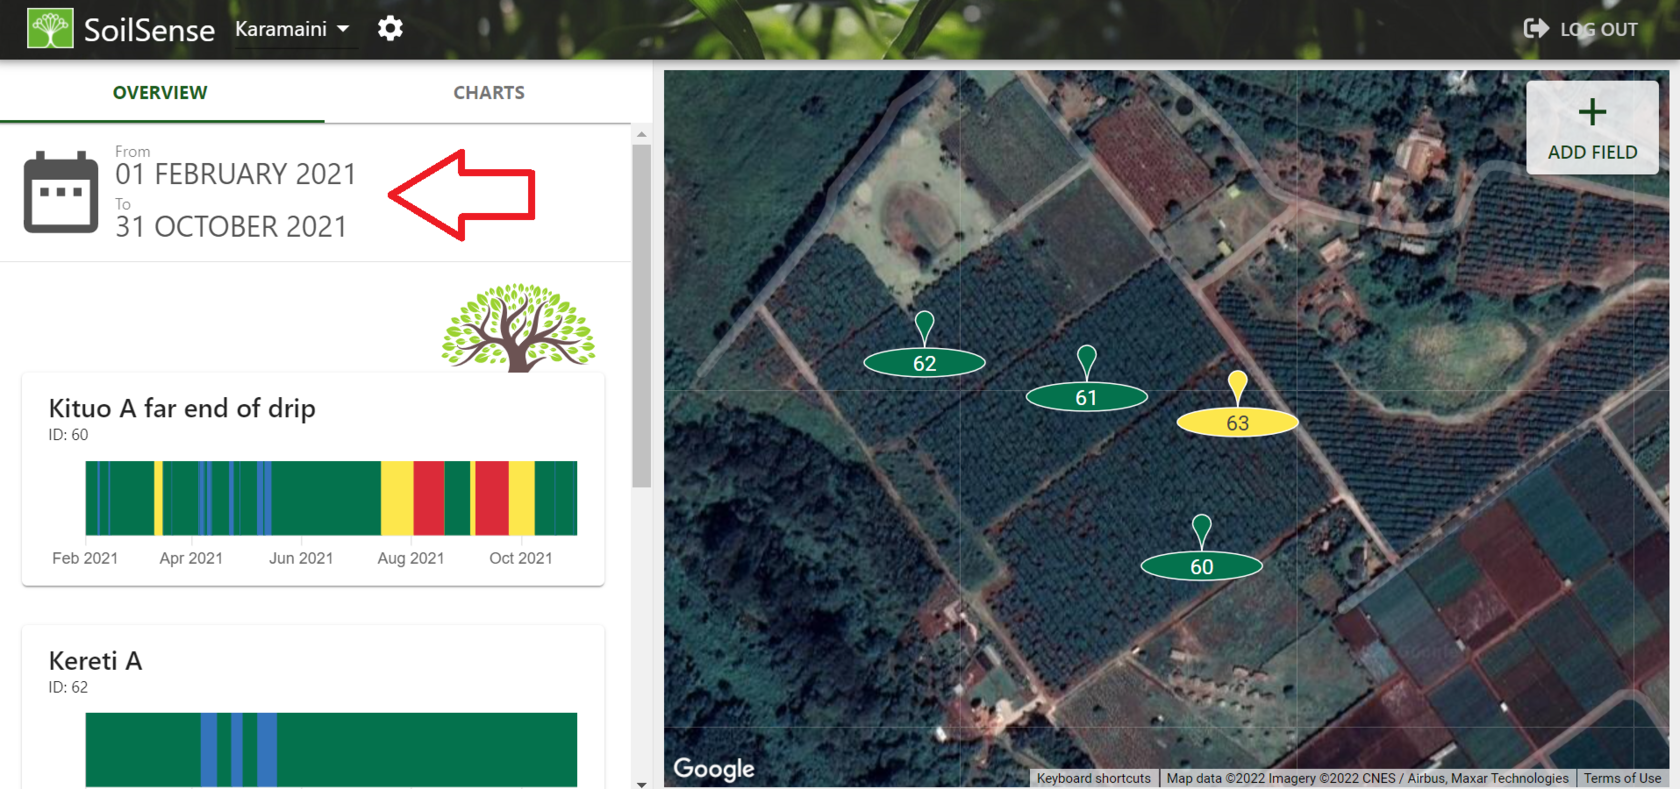
Full season overview in matter of seconds
The SoilSense plant health bars update in accordance with the date selection, and the feature can also be used to load data for an entire season to obtain an overview.The most recent date of the selection is what determines the state of the map-colors.

We hope you enjoy our new feature, please let us know if you have any questions or suggestions to make SoilSense even easier to use!
